PWL device models are accurate for switching power converter applications because these devices spend most of a switching period in either their conduction or blocking states and transition very rapidly these two states. The areas where the PWL models have higher error occur during switching transitions where the model spends a very small portion of each switching cycle.
In this topic:
Key Concepts
This topic addresses the following key concepts:
PWL models are accurate both the time and frequency domains.
What You Will Learn
In this topic, you will learn the following:
Why PWL models can accurately model the behavior of switching power systems.
Getting Started
The three examples in this section compare simulation results of different switching power supplies with measured lab data.
Discussion
When used to model switching power systems, Piecewise Linear (PWL) models can provide a high degree of accuracy. The inherent approximations of SIMPLIS time-domain device models need not seriously degrade the accuracy of the simulation results. A well constructed PWL model is designed to spend very little time in the areas where these PWL approximations have higher error. In section 1.0.2 PWL Simulation and Modelling, the forward transfer characteristic of a diode is depicted. In a switching power supply, the diode is often used as a passive switch. Consequently, a rectifying diode spends the vast majority of the time either blocking current flow or conducting. Very little time is spent in the transition between these two states. With a simulation objective of modeling the closed-loop behavior of a power supply, the PWL approximations used to model the knee region of a rectifying diode contribute an insignificant error to the accuracy of the system behavioral model.
The three examples described below compare the SIMPLIS results with actual hardware testing.
Transient Example: Single Phase SyncBuck
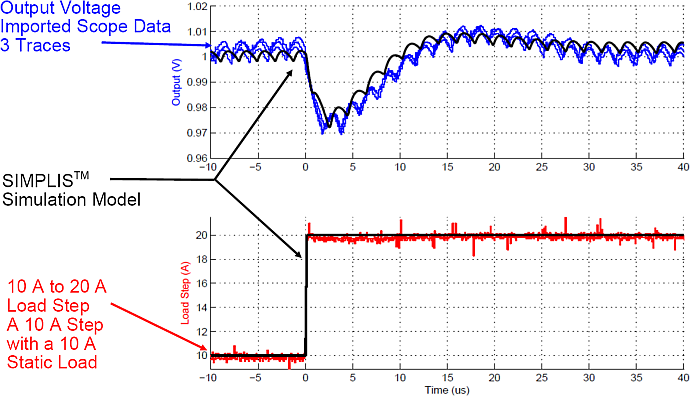
This example comes from a single-phase, digitally-controlled, synchronous Buck converter. These oscilloscope images of the output voltage and output current were taken with three triggers of the hardware measurement. The SIMPLIS simulation results were overlaid on the hardware data. The maximum error during both a step load increase and step load decrease is 0.5%.
Step load increase from 10A to 20A
Time-domain simulation vs. experimental results

Step load decrease from 20A to 10A
Time-domain simulation vs. experimental results

Transient Example: Quasi-Resonant Flyback Converter
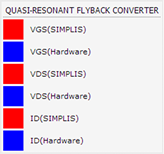
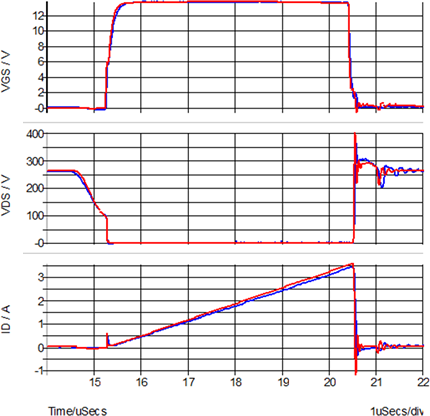
By including PWL capacitors to model the non-linear capacitances of the MOSFET, SIMPLIS can also do a good job of modeling the device switching transitions. This example is from a Quasi-Resonant Flyback Converter used in an AC adapter application. The main MOSFET and output rectifiers in the example were automatically converted from the SPICE models with the Model Parameter Extraction algorithms. The resulting SIMPLIS model correlates well to the hardware measurements of the gate-to-source voltage, drain-to-source voltage and drain current.

|

|
AC Example: Self Oscillating Flyback Converter
Numerically, SIMPLIS finds an extremely accurate solution to its system of PWL circuit equations that describe the time-domain behavior of a switching power supply. As discussed later in much more detail, SIMPLIS exploits this capability to find a very accurate steady-state periodic operating point of a switching system. Once the system is in steady state, SIMPLIS can inject an extremely small AC signal at a particular frequency into the system and then measure the time-domain response to that injected signal. By repeatedly performing this analysis at different frequencies, and then presenting the results as a function of the injected frequency, SIMPLIS is able to perform very accurate AC analysis using only the full nonlinear time-domain circuit model. No average AC modeling is required. There is also no requirement that the system employ constant-frequency control. The only requirement is that the system be in stable steady-state operation.
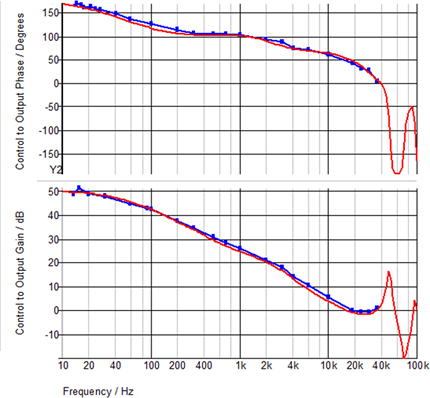
Because SIMPLIS is always simulating the nonlinear time-domain response, the AC analysis includes any effect of ripple voltages in the control signal path, which are generally ignored with averaged model techniques. As a result, with a carefully constructed model, the SIMPLIS AC analysis can closely match experimental data even when minute details of the converter operation are included.
The following graph compares the SIMPLIS AC analysis in red with bench measurements in blue on a hardware prototype. These simulation results were taken from the Self-Oscillating Converter circuit example from the 1.0.1 SIMPLIS is a time-domain simulator, all the time, for every analysis, period topic.

|

|
Conclusions and Key Points to Remember
- PWL modeling techniques can be quite accurate in the modeling of switching power systems.
- A PWL model should be designed to spend a very small proportion of the switching cycle in the area where the PWL model has higher approximation error.
- SIMPLIS can analyze circuits which do not have a closed form small signal model. The variable frequency Self-Oscillating converter is an example, as is the LLC converter.