DVM - Design Verification Module
DVM - Design Verification Module
|
The Full Power Assist DVM control symbol stores the same information as the Basic DVM control symbol, but also includes additional design demographic information and performance specifications that you enter into the five main tabs of the DVM Control dialog.
In this Topic Hide
To add a Full Power Assist DVM symbol to a working schematic, follow these steps:
| Label | Parameter Description |
| Circuit Specifications: General information about the circuit | |
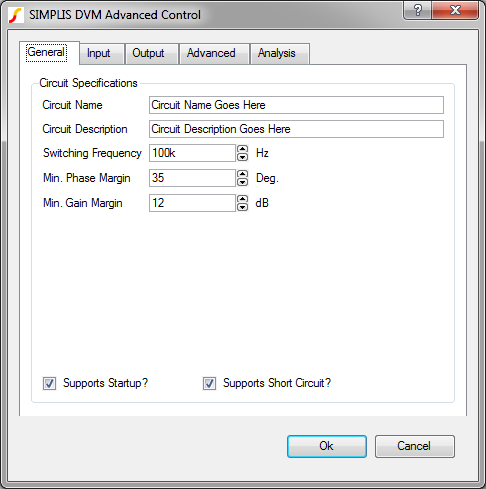
| Circuit Name | Name of the circuit as it will appear in the DVM report; for display purposes only. |
| Circuit Description | Description of the circuit under test which appears in the DVM Control symbol; for display purposes only. |
| Switching Frequency: Nominal switching frequency used to calculate simulation timing for DC/DC test objectives | |
Note: For AC/DC tests, the F_LOW and F_HIGH symbolic frequencies on the AC Input tab are used instead of the value of the switching frequency on the General tab. |
|
| Min. Phase Margin | Minimum gain margin specification for BodePlot test objective. |
| Min. Gain Margin | Minimum gain margin specification for BodePlot test objective. |
| Supports Startup? | If checked, the startup tests will be performed; if not checked, the startup tests will be skipped. |
| Supports Short Circuit? | If checked, the short circuit tests will be performed; if not checked, the short circuit tests will be skipped. |
The General tab allows you to define circuit descriptions and specifications that DVM uses when measuring and checking scalar values in the simulation.
| Label | Parameter Description |
| Circuit Specifications: General information about the circuit | |
| Circuit Name | Name of the circuit as it will appear in the DVM report; for display purposes only. |
| Circuit Description | Description of the circuit under test which appears in the DVM Control symbol; for display purposes only. |
| Switching Frequency: Nominal switching frequency used to calculate simulation timing for DC/DC test objectives | |
Note: For AC/DC tests, the F_LOW and F_HIGH symbolic frequencies on the AC Input tab are used instead of the value of the switching frequency on the General tab. |
|
| Min. Phase Margin | Minimum gain margin specification for BodePlot test objective. |
| Min. Gain Margin | Minimum gain margin specification for BodePlot test objective. |
| Supports Startup? | If checked, the startup tests will be performed; if not checked, the startup tests will be skipped. |
| Supports Short Circuit? | If checked, the short circuit tests will be performed; if not checked, the short circuit tests will be skipped. |
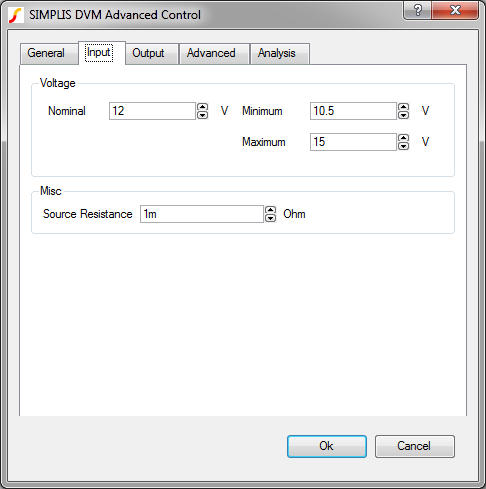
The Input tab allows you to set properties for a DC input source in your circuit.
| Label | Parameter Description |
| Voltage: Values used set up the simulation test conditions | |
| Nominal | Nominal input voltage |
| Minimum | Minimum input voltage |
| Maximum | Maximum input voltage |
| Misc | |
| Source Resistance | Input source resistance |
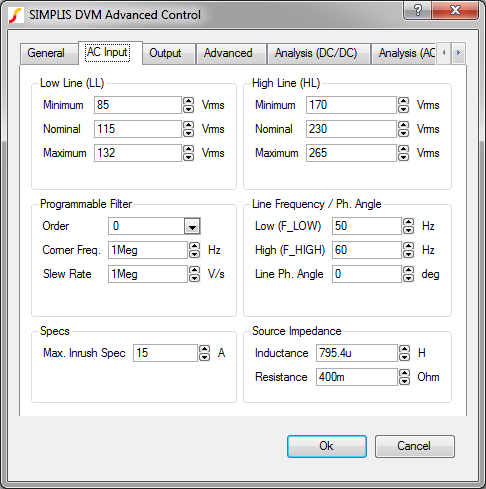
The AC Input tab allows you to set properties for an AC input source in your circuit.
| Label | Parameter Description |
| Low Line (LL): RMS voltages for the low-line condition | |
| Minimum | Minimum AC low-line input in volts RMS |
| Nominal | Nominal AC low-line input in volts RMS |
| Maximum | Maximum AC low-line input in volts RMS |
| High Line (HL): RMS voltages for the high-line condition | |
| Minimum | Minimum AC high-line input in volts RMS |
| Nominal | Nominal AC high-line input in volts RMS |
| Maximum | Maximum AC high-line input in volts RMS |
| Programmable Filter: All DVM AC input sources use a programmable filter with 1 to 3 poles at a common corner frequency. | |
| Order | Number of poles at a common corner frequency for the programmable filter. To remove the programmable filter from the circuit, set this value to zero. |
| Corner Freq. | Common corner frequency for the programmable filter |
| Slew Rate | Maximum slew rate limit for the DVM AC input source in volts per second. To remove the slew rate limiter from circuit, set this value to zero. |
| Line Frequency / Ph. Angle: Settings for line frequencies used in built-in AC/DC testplans | |
| Low (F_LOW) | Frequency value assigned to the symbolic name F_LOW for the lower of two line frequencies. Typically this frequency is 50Hz and the symbolic name can be entered in the testplan AC/DC objectives. |
| High (F_HIGH) | Frequency value assigned to the symbolic name for the higher of two line frequencies |
| Line Ph.Angle | Phase angle of the AC source at time equals zero |
| Specs: Specifications used in AC/DC test objectives | |
| Max. Inrush Spec | Specification for the maximum current allowed to be drawn off of the AC source |
| Source Impedance: All AC sources have a programmable source impedance. For an ideal source, set the inductance or resistance to zero. | |
| Note: If the source inductance is set to a non-zero value and the circuit has an inductor at the input, there may be problems in finding the bias point of the circuit. A simple fix is to lump the inductance in either this source or your circuit. | |
| Inductance | The inductance value for the AC source; zero is allowed. |
| Resistance | The resistance value for the AC source; zero is allowed. |
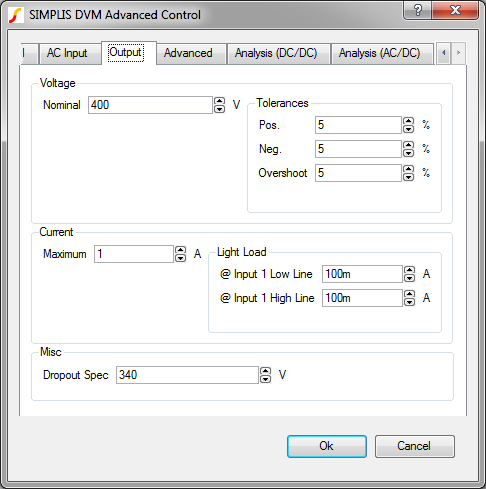
The Output tab allows you to set properties for the output load in your circuit.
| Label | Parameter Description |
| Voltage: Specifications for output voltage | |
| Nominal | Nominal DC output voltage |
| Tolerances: Specifications for output voltage tolerances | |
| Pos. | Maximum positive percentage tolerance |
| Neg. | Maximum negative percentage tolerance |
| Overshoot | Maximum percentage tolerance for output voltage overshoot |
| Current: Specifications for output current | |
| Maximum | Maximum output current at 100% load |
| Light Load: Specifications for minimum output current | |
| @ Input 1 min | Light load specification (where POP analysis will succeed) when input 1 is at its minimum voltage |
| @ Input 2 max | Light load specification (where POP analysis will succeed) when input 1 is at its maximum voltage |
| Misc (appears only when you have an AC Input) | |
| Dropout Spec | Minimum output voltage specification for LineDropout test objective. |
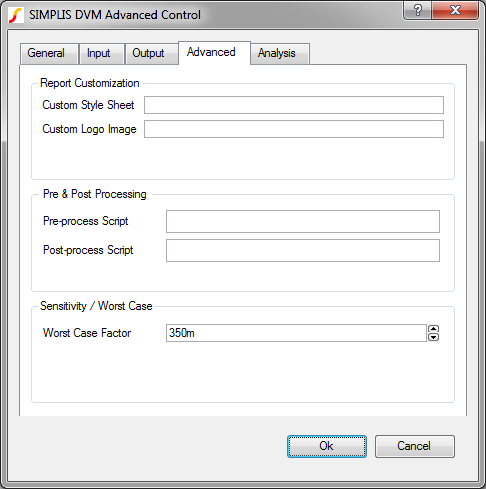
The Advanced tab allows you to customize the pre- and post-processing behavior for a schematic as well as the appearance of the simulation report.
| Label | Parameter Description |
| Report Customization: Options to customize the appearance of the DVM report | |
| Custom Style Sheet | Cascading Style Sheet (CSS) file to use with the DVM report |
| Custom Logo Image | Portable Network Graphics (PNG) file to use with the DVM report |
| Pre & Post Processing | |
| Pre-process Script | SIMetrix script to be executed immediately before launching each simulation; this allows you to adjust a schematic before running the test. |
| Post-process Script | SIMetrix script to be executed immediately after each simulation successfully completes; this allows you full access to perform waveform manipulation and create custom scalar and spec values. |
| Sensitivity/Worst Case: Specifications for sensitivity and worst case analysis | |
| Worst Case Factor | During sensitivity analysis, each design parameter is increased by an amount equal to the worst-case factor multiplied by the user-defined tolerance for that design parameter. |
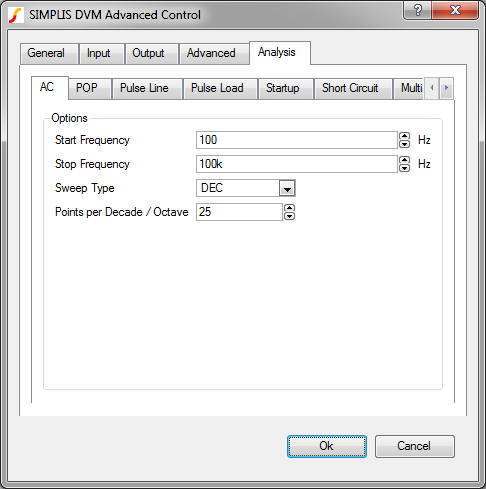
The Analysis tab for a DC/DC circuit has seven sub categories of parameters: AC, POP, Pulse Line, Pulse Load, Startup, Short Circuit, and Multi-tone. If you are using an AC/DC circuit, see AC/DC_Analysis.
Note: When you have a DC Input, this tab is labeled Analysis. The DC/DC Analysis is the label when you have an AC/DC circuit.
The AC tab allows you to set options for parameters pertaining to test objectives for AC analyses.
| Label | Parameter Description |
| Options: BodePlot, Impedance and Conducted Susceptibility test objectives | |
| Start Frequency | Start frequency for AC analyse |
| Stop Frequency | Stop frequency for AC analyses |
| Sweep Type | AC sweep type: DEC or LIN |
| Points per Decade / Octave | Number of data points collected per decade or octave |
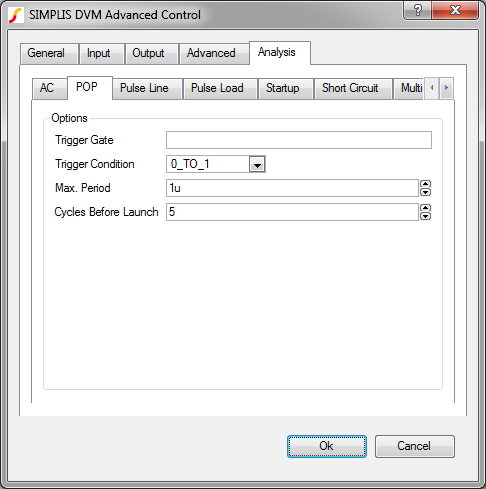
The POP tab allows you to define options for the SteadyState test objective and for any other test objective that includes a SIMPLIS .POP analysis, such as Line and Load Regulation. Most of these parameters can be automatically detected if you select DVM Reset Analysis Parameters from the menu bar in the schematic editor.
Note: A successful POP run is a prerequisite for AC analyses.
| Label | Parameter Description |
| Options | |
| Trigger Gate | Device name of a defined logic gate considered the triggering gate of the POP analysis |
| Trigger Condition | Trigger condition that defines the beginning of a new switching cycle for the POP analysis |
| Max. Period | Defines the lowest frequency where POP looks for a steady-state solution |
| Cycles Before Launch | Number of cycles before the POP algorithm attempts to determine a steady-state solution |
For more information on these parameters, see Chapter 10, SIMPLIS POP,
in the SIMPLIS Reference manual. If your circuit
is pre-configured to run an AC analysis when you place the DVM control
symbol, these values will be automatically extracted from your schematic.
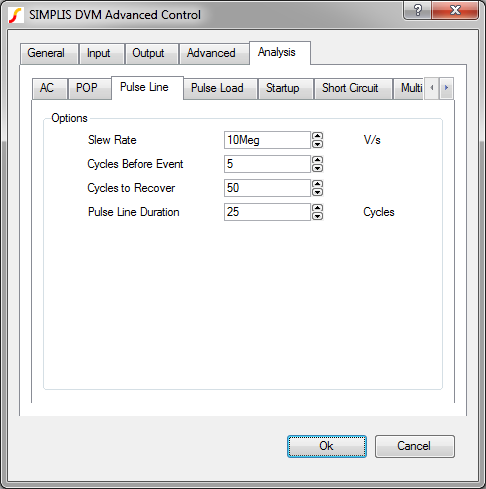
The Pulse Line tab allows you to change options for the Pulse/Step Line test objective.
| Label | Parameter Description |
| Options | |
| Slew Rate | Maximum rate of change of the source voltage |
| Cycles Before Event | Combined with the nominal switching frequency, this parameter determines the length of time before the start of the line transient. |
| Cycles to Recover | Combined with the nominal switching frequency, this parameter determines the length of time that the circuit has to recover after the end of the line transient. |
| Pulse Load Duration | The time duration of the line pulse expressed in the number of switching cycles. |
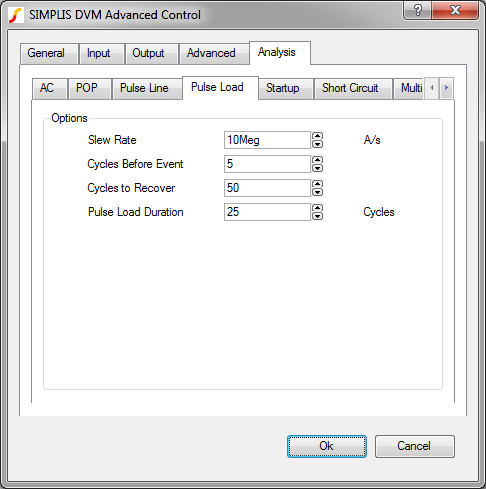
The Pulse Load tab allows you to change options for the Pulse/Step Load test objective.
| Label | Parameter Description |
| Options | |
| Slew Rate | Maximum rate of change of the output load |
| Cycles Before Event | Combined with the nominal switching frequency, this parameter determines the length of time before the start of the load transient. |
| Cycles to Recover | Combined with the nominal switching frequency, this parameter determines the length of time that the circuit has to recover after the end of the load transient. |
| Pulse Load Duration | The time duration of the load pulse expressed in the number of switching cycles. |
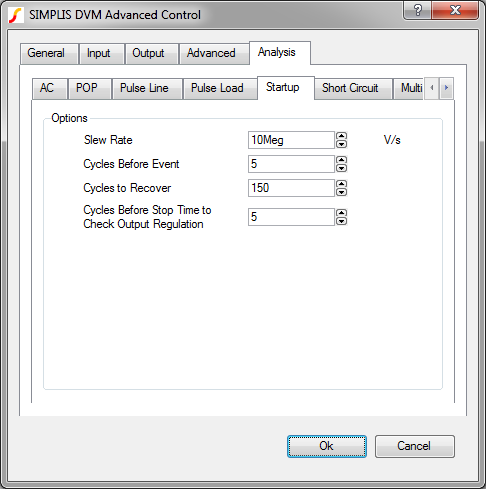
The Startup tab allows you to change options for the Startup test objective.
| Label | Parameter Description |
| Options | |
| Slew Rate | Maximum rate of change of the source voltage |
| Cycles Before Event | Combined with the nominal switching frequency, this parameter determines the length of time before the start of the startup transient. |
| Cycles to Recover | Combined with the nominal switching frequency, this parameter determines the length of time that the circuit has to recover after the end of the startup transient. |
| Cycles Before Stop Time to Check Output Regulation |
Combined with the nominal switching frequency, this parameter determines the length of time at the end of the simulation in which the circuit is examined to determine that it is in regulation. |
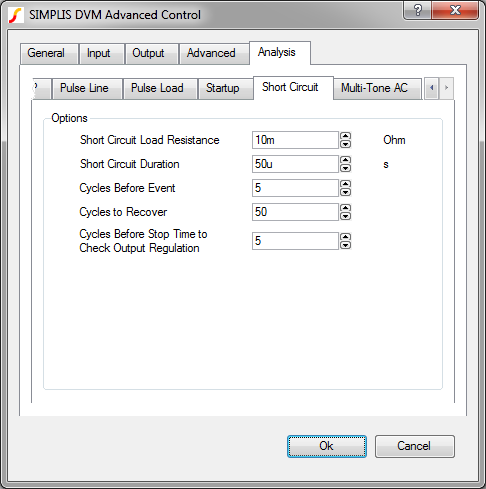
The Short Circuit tab allows you to change options for the ShortCkt test objective.
| Label | Parameter Description |
| Options | |
| Short Circuit Load Resistance | On resistance of the switch used to implement the short circuit |
| Short Circuit Duration | Length of the short circuit event |
| Cycles Before Event | Combined with the nominal switching frequency, this parameter determines the length of time before the start of the short circuit. |
| Cycles to Recover | Combined with the nominal switching frequency, this parameter determines the length of time that the circuit has to recover after the end of the short circuit. |
| Cycles Before Stop Time to Check Output Regulation |
Combined with the nominal switching frequency, this parameter determines the length of time at the end of the simulation in which the circuit is examined to determine that it is in regulation applies only to Short Circuit and Recover tests). |
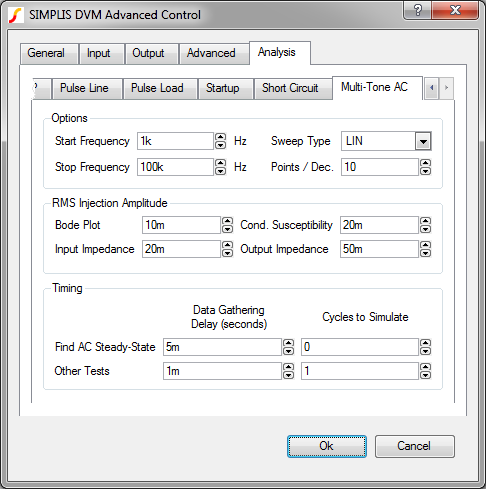
The Multi-Tone AC tab allows you to change parameters pertaining to short circuit analyses.
| Label | Parameter Description |
| Options | |
| Start Frequency | The lowest injection frequency for the multi-tone sweep. Because this input also sets the total simulation time in integer multiples of 1/Start Frequency, you should avoid very low frequencies. For details, see the Timing group below. |
| Stop Frequency | The highest injection frequency for the Multi-Tone Sweep. |
| Sweep Type | The following sweep types are available:
All sweeps are limited to 100 frequencies. This practically limits the LIN sweeps to two decades, whereas the DEC and DEC2 sweeps can be used for four or more decades. For details, seePoints/Dec. below. |
| Points/Dec. | The maximum number of points for DECand DEC2 sweeps; not used for LIN sweep types. As more frequencies are injected, the signal-to-noise in the system decreases and the AC output waveforms become noisier. Additionally, a high number of injected frequencies will slow down the simulation considerably. For this reason, using as few frequencies as possible produces the best results. |
| RMS Injection/Amplitude | |
| Bode Plot | The RMS voltage injected for the Bode Plot test objectives |
| Input Impedance | The RMS voltage injected for the Input Impedance test objectives |
| Cond. Susceptibility | The RMS voltage injected for the Output Impedance test objectives |
| Output Impedence | The RMS voltage injected for the Conducted Susceptibility test objectives |
| Timing | |
| Data Gathering Delay: Find AC Steady-State |
Find AC Steady-State data will be collected for this number of Start Frequency cycles after the Data Gathering Delay. The Find AC Steady-State tests generate an initial conditions file. The only reason to make this parameter non-zero is if you wish to observe the settling behavior of the converter. |
| Data Gathering Delay: Other Tests |
This parameter sets the time delay before data is generated during Find AC Steady-State tests. The Data Gathering Delay time needs to be set to allow the circuit to settle completely into steady state. For the Fourier analysis to yield noise free results, the circuit must be completely settled; and, therefore, set this time delay generously. |
| Cycles to Simulate: Find AC Steady-State |
This parameter determines the simulation time span: stop time - start time; thus, this determines how much simulation data is output for all test objectives except for Find AC Steady-State. For example, if the Start Frequency is 1kHz and this entry is 2, the simulation will have 2ms of simulated data. |
| Cycles to Simulate: Other Tests |
This parameter sets the time delay before data is generated for all tests except Find AC Steady-State. Typically, the initial conditions file generated from a Find AC Steady-State test will be extremely close to the circuit's steady state and this delay can be set to zero. If there is some residual transient, this delay can be set to allow the circuit to settle before simulation data is generated. |
The Analysis tab for a DC/DC circuit has five sub categories of parameters: Steady-State, Line Dropout, Line Surge/Sag, Pulse Load, and Startup. If you are using an DC/DC circuit, see DC/DC_Analysis.
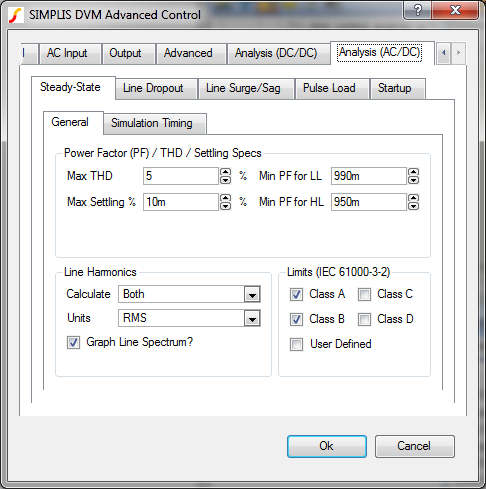
The Steady State: General tab allows you to change the steady-state specifications.
| Label | Parameter Description |
| Power Factor / THD / Settling Specs: Specifications for the AC steady-state analyses | |
| Max THD | Maximum total harmonic distortion allowed for input source; specified as a percentage of the fundamental |
| Max Settling | Maximum percent difference between the mean values of the output voltage over the last two lines cycles |
| Min PF for LL | Minimum power factor for low-line tests |
| Min PF for HL | Minimum power factor for high-line tests |
| Line Harmonics | Options to configure how line harmonics are presented in the DVM report |
| Calculate | Select the line harmonics for which you want to generate scalar values for the DVM report; the menu options are None, Odd, Even, Both. |
| Units | The units for the reported line harmonic scalar values; the menu options are RMS, % Fundamental, mA/W. |
| Graph Line Spectrum? | If checked, DVM will generate a plot of the line
harmonics for the AC input source.
|
| Limits (IEC 61000-3-2) | Specifications for line harmonic current limits. If checked, the measured line harmonic currents will be compared against the specified limits. |
| Class A | If checked, measured line harmonic currents will be compared against IEC 61000-3-2 Class A harmonic limits. |
| Class B | If checked, measured line harmonic currents will be compared against IEC 61000-3-2 Class B harmonic limits. |
| Class C | If checked, measured line harmonic currents will be compared against IEC 61000-3-2 Class C harmonic limits. |
| Class D | If checked, measured line harmonic currents will be compared against IEC 61000-3-2 Class D harmonic limits. |
| User Defined | If checked, measured line harmonic currents will be compared against user-specified limits. The limits are defined in a simple plain text file. For a full description, see the AC/DC Harmonic Specifications topic. |
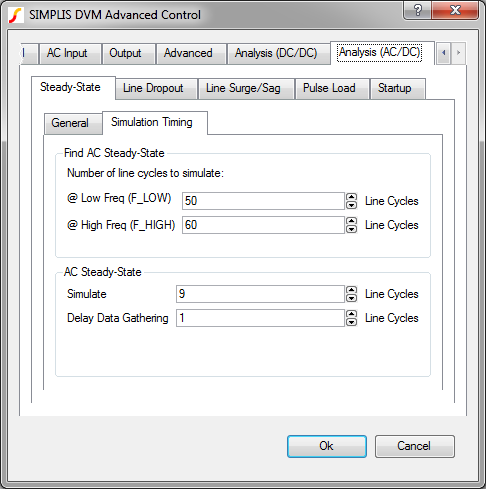
The Steady-State: Simulation Timing tab allows you to change timing inputs for the FindACSteadyState test objective.
| Label | Parameter Description |
| Find AC Steady-State: timing parameters that determine the length of the transient simulation used to find the AC Steady-State | |
| @Low Freq (F_LOW) | Number of line cycles to simulate in order to find the steady state operating point of the circuit at the lower frequency. Using the default values, this results in a stop time of 1s. |
| @High Freq (F_HIGH) | Number of line cycles to simulate in order to find the steady state operating point of the circuit at the higher frequency. Using default values, this results in a stop time of 1s. |
| AC Steady-State: parameters that determine the length of the simulation and when to start collecting waveform data | |
| Simulate | Maximum number of lines cycles to simulate. In combination with the line frequency, this determines the stop time of the simulation. |
| Delay Data Gathering | Number of line cycles before data generation starts. Usually, this can be set to zero. |
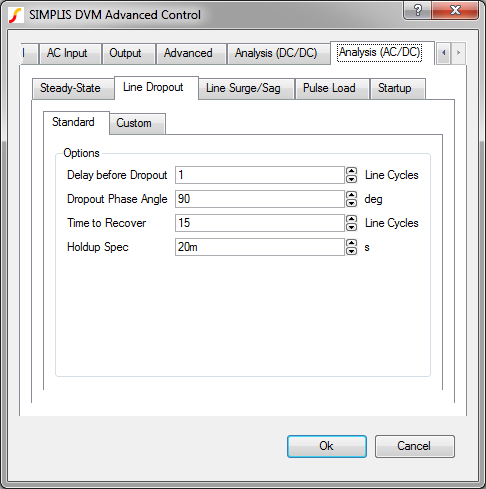
The Line Dropout: Standard tab allows you to change timing specifications for the 0.5 and 1 line cycle dropout tests.
| Label | Parameter Description |
| Options | |
| Delay before Dropout | Number of full line cycles before dropout initiation. |
| Dropout Phase Angle | The phase angle when the line drop out starts, in degrees. |
| Time to Recover | Number of line cycles to simulate after the line returns to normal. |
| Holdup Spec | Maximum hold-up time specification for all outputs. |
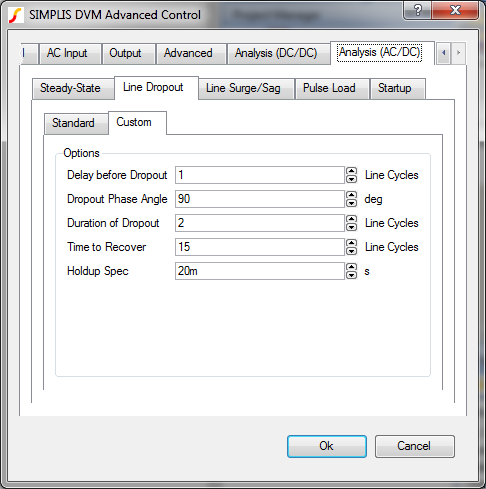
The Line Dropout: Custom tab allows you to change timing specifications for a user-configured line dropout test.
| Label | Parameter Description |
| Options | |
| Delay before Dropout | Number of full line cycles before dropout initiation |
| Dropout Phase Angle | The phase angle, specified in degrees, when the line dropout starts |
| Duration of Dropout | Duration of the dropout in line cycles |
| Time to Recover | Number of line cycles to simulate after the line returns to normal |
| Holdup Spec | Maximum hold-up time specification for all outputs |
The Line Surge/Sag: Low Line tab allows you to change the timing specifications for line surge/sag tests for the low-line input.
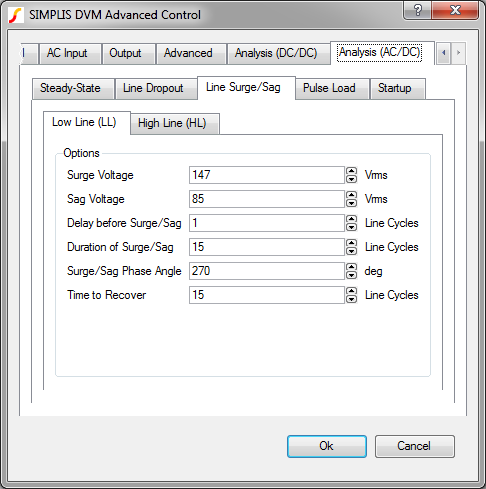
| Label | Parameter Description |
| Options | |
| Surge Voltage | Voltage to which the line surges for LineSurge test objectives, specified in volts RMS |
| Sag Voltage | Voltage to which the line sags for LineSag test objectives, specified in volts RMS. |
| Delay before Surge/Sag | Number of full line cycles to simulate before initiating line surge or line sag |
| Duration of Surge/Sag | Duration of surge or sag, specified in line cycles |
| Surge/Sag Phase Angle | The phase angle at which the line surge or sag is initiated |
| Time to Recover | Number of line cycles to simulate after the line returns to normal |
The Line Surge/Sag: High Line tab allows you to change timing specifications for line surge/sag tests for the high-line input.
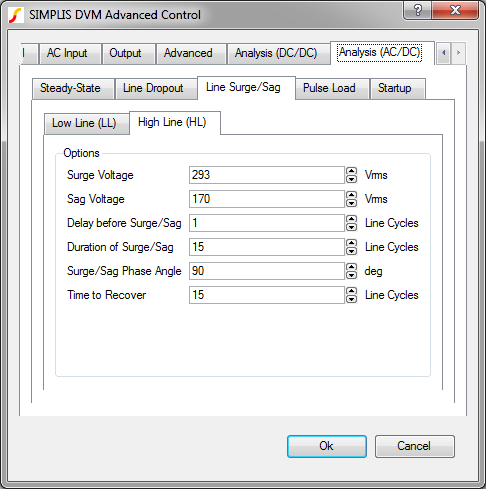
| Label | Parameter Description |
| Options | |
| Surge Voltage | Voltage to which the line surges for LineSurge test objectives, specified in volts RMS |
| Sag Voltage
|
Voltage to which the line sags for LineSag test objectives, specified in volts RMS |
| Delay before Surge/Sag | Number of full line cycles to simulate before initiating the line surge or line sag |
| Duration of Surge/Sag | Duration of surge or sag, in line cycles |
| Surge/Sag Phase Angle | The phase angle at which the line surge or sag is initiated |
| Time to Recover | Number of line cycles to simulate after the line returns to normal |
The Pulse Load tab allows you to change timing specifications for the load transient pulse.
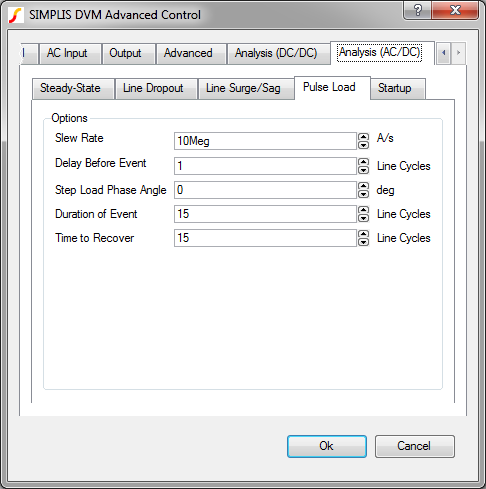
| Label | Parameter Description |
| Options | |
| Slew Rate | Maximum slew rate at which the load current changes, specified in A/s |
| Delay before Event | Number of full line cycles to simulate before initiating the load pulse |
| Step Load Phase Angle | Line phase angle at which the load pulse is initiated |
| Duration of Event | Duration of the load pulse, specified in line cycles |
| Time to Recover | Number of line cycles to simulate after the load returns to the non-pulse amplitude. |
The Startup tab allows you to change timing specifications for the LineStartup and ControlStartup test objectives.
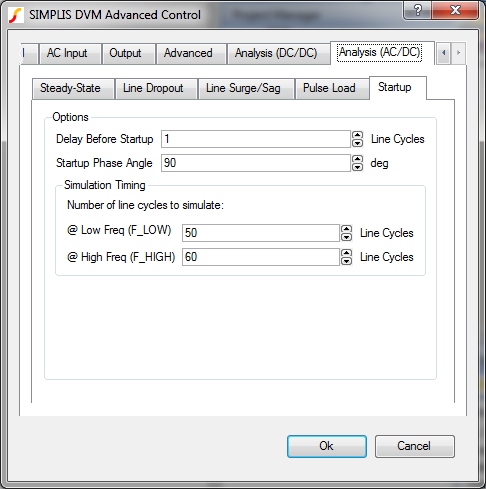
| Label | Parameter Description |
| Options | |
| Delay before Startup | Number of full line cycles to delay start up |
| Startup Phase Angle | Phase angle at which the line or control startup occurs |
| Simulation Timing: Number of line cycles to simulate | |
| @Low Freq (F_LOW) | The stop time is calculated from this value (50 line cycles) divided by the F_LOW value from the AC Input tab (50Hz). In this example, therefore, the stop is 1s. |
| @Low Freq (F_HIGH) | The stop time is calculated from this value (50 line cycles) divided by the F_LOW value from the AC Input tab (50Hz). In this example, therefore, the stop is 1s. |
© 2015 simplistechnologies.com | All Rights Reserved