| TITLE | SIMPLIS DC/DC DVM Tutorial Part I - Getting Started |
| APPLIES TO | SIMetrix/SIMPLIS DVM v7.1a |
| KEYWORDS | dvm, tutorial, getting started, ltc3406b |
| DESCRIPTION | Getting started tutorial for the SIMetrix/SIMPLIS Design Verification Module using the LTC3406B as an example. |
| REVISION | pre-release |
SIMPLIS DVM Tutorial Part 1 - Getting Started
- 1.0 Intro to DVM
- 2.0 Getting Started
- 3.0 Configuring a schematic to use the Full PowerAssist features
- 3.4 Adding Three Terminal Output Load
- 3.5 Adding Full PowerAssist Control
- 3.6 Managing Sources And Loads
- 3.7 Setting Control Parameters
- 3.8 Schematic Configured for Full PowerAssist
- 3.9 Selecting a Built-In Testplan
- 3.10 Viewing Output Report
- 4.0 Adding Curves and Scalars Measurements to the Report
- 5.0 Running the Built-In Efficiency and Line and Load Regulation Testplans
SIMPLIS DVM Tutorial Part 2 - Advanced Topics
- 6.0 Customizing Testplans
- 6.1 Changing Parameter values using the Var and Globalvar Functions
- 6.2 Changing Component Values with the Change Function
- 6.3 Changing the Schematic using Jumpers
- 6.4 The Measurement Testplan Entry
- 6.4.1 Creating Scalar Aliases
- 6.4.2 Promoting Graphs to the Overview Report
- 6.4.3 Promoting Scalars to the Overview Report
- 6.4.4 Suppressing Curve Generation
- 6.4.5 Suppressing Scalar Generation
- 6.4.6 Suppressing Specification Generation
- 6.5 Generating Curves from the Current Simulation Data
- 6.6 Comparing data from previous simulations
- 7.0 Miscellaneous Topics
- 7.1 Pre-Process Scripts
- 7.2 Post-Process and Final-Process Scripts
- 7.3 User-Defined Scalar and Spec Values
- 8.0 Applications
- 8.1 Characterizing Device Level Power Losses
- 8.2 Measuring Control Loop Parameters over Line and Load variation
- 8.3 Summary
SIMPLIS DVM Tutorial Part 1 - Getting Started
1.0 Intro to DVM
The SIMetrix/SIMPLIS Design Verification Module (DVM) provides the ability to automate:
- The execution of multiple user-defined simulation tests
- Make measurements on and specification checking of those results, and
- The generation of a comprehensive summary report with individual test pass/fail status, tables of scalar and specification results and links to individual test's graphical data
DVM has several built-in testplans, including versions specially prepared for DC/DC and AC/DC converters. DVM also supports custom user-defined testplans allowing for the configuration of both the SIMetrix and the SIMPLIS simulation engines, analysis directives, component values and various test conditions. A properly configured schematic can also take advantage of DVM's Sensitivity and Worst Case analysis functions.
1.1 Supported Operations
The SIMetrix/SIMPLIS DVM testplan allows a user to specify the following on a test by test basis:
- Simulation Engine (DVM supports both SIMetrix and SIMPLIS)
- Analysis Statements (
.AC,.TRAN,.POP,.DC, etc...) - Full PowerAssist Test Objectives ( Bode Plot, Pulse Load, etc. )
- Include Files
- Custom Pre- and Post-process Scripts
- Changes to Component Properties
.VAR,.PARAMand.GLOBALVARStatements for Circuit Parametrization- Change Jumper Positions for Schematic Configuration
- Curve generation from current test data or data aggregated from all previous tests
- Temperature (SIMetrix Only)
1.2 Design Session Flow
- Working Schematic - Before converting a schematic to run in DVM, it is assumed that the schematic simulates correctly. With its capability to automate the execution and analysis of a wide range of simulation objectives, DVM is an excellent tool to detect design or modeling errors. However, it is not necessarily the best tool to debug and correct fundamental design or modeling issues. It is strongly recommended that the user first verify that their schematic will simulate correctly in each of the intended analysis modes before initiating a DVM analysis.
- DVM Symbols - One of the two types of DVM Control symbols (Basic or Full PowerAssist) must be placed on the schematic in order for the circuit to support DVM automation. To use the built-in testplans, the "Full PowerAssist" control symbol and at least one managed DVM Source and at least one managed DVM Load are required.
- DVM Testplan - A DVM Testplan is essentially a list of test definitions contained in a tab-separated text file. Each non-blank, non-comment line in the file is interpreted as a simulation test to be executed. Several built-in testplans are available to help get started.
- Test Selection - A DVM Testplan can contain hundreds of tests; depending on the situation, it may not be desirable to run all of them at once. The DVM Test Selection Dialog allows the user to run any subset of the testplan.
- Test Report - After execution of the testplan, DVM automatically generates an overview report showing the status of all the tests run with links to each individual test report.
1.3 Documentation Links
The following links may be useful for further reading during or after the tutorial.
2.0 Getting Started
This tutorial will use the LTC3406B Synchronous Rectified Buck converter schematic to demonstrate the features and operation of the SIMetrix/SIMPLIS Design Verification Module. This model was developed solely from publicly available information found in the product's datasheet. The schematic can be found in the zip file distributed with this tutorial (download).
2.1 Notes about the images in this tutorial
The images in this tutorial are shown thumbnail sized for quick loading. A full sized image can be viewed by clicking anywhere on the image. To close the full sized view, either click the image again, or click the "X" in the upper right hand corner of the full sized image.
2.2 Starting Schematic
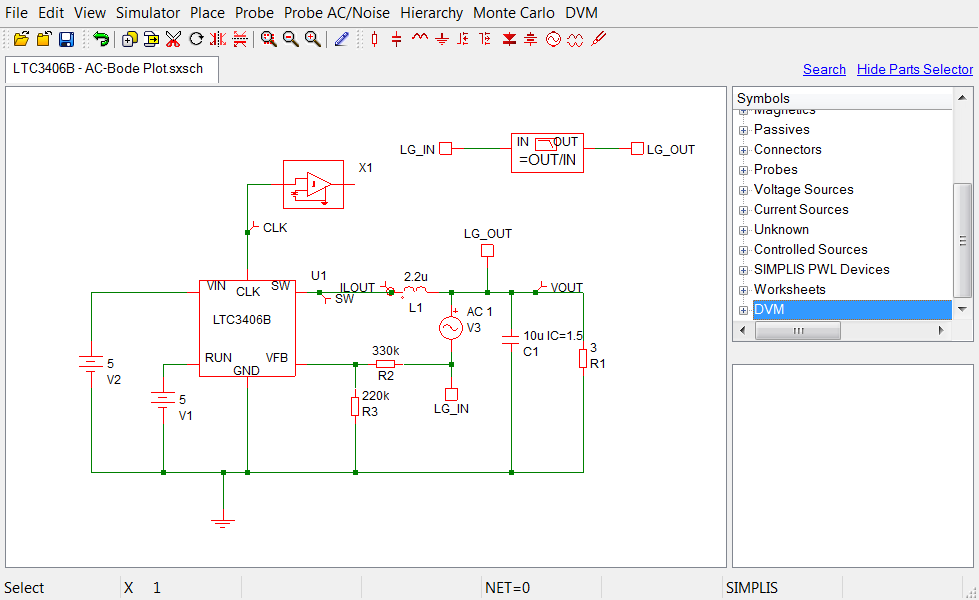
To start with, use SIMetrix/SIMPLIS DVM v7.1a or later to open the following schematic from the tutorial zip file.
LTC3406B/Test Ckts/LTC3406B - AC-Bode Plot.sxsch
The LTC3406B is a Synchronous Buck integrated circuit and this schematic is configured to execute an Ac Analysis and generate a bode plot using the usual SIMPLIS single run analysis. We will take this circuit and configure it to run several the built-in testplans in the DVM simulation environment.
3.0 Configuring a schematic to use the Full PowerAssist features
DVM comes with several built-in testplans, including one specifically tailored for the Synchronous Buck topology. The built-in DVM testplans take advantage of the Full PowerAssist features which require the use of managed sources and loads. We discuss what is meant by managed sources and loads, then describe the use of the Full PowerAssist DVM Control Symbol. We then add each of these elements to our working schematic. As we will see this process is very simple and can often be completed in as little as 5 min.
3.1 Managed Sources and Loads
What is meant by "Managed Source" symbol or "Managed Load" symbol? Quite simply, these source and load symbols can represent any number of different electrical definitions from a library of source and load subcircuits. In much the same way that one MOSFET symbol can represent any number of ASCII text-based subcircuit electrical definitions, these Managed Source and Managed Load symbols represent different electrical subcircuit definitions, depending on the test objective of a particular simulation test. In one test, the Managed Load symbol may be represented as a simple load resistor, and in another test, the Managed Load may have a special transient behavior - such as a pulsed load to simulate a load transient. In the case of an AC Bode Plot analysis, the Managed Load subcircuit will include the injected ac source and the Bode Plot probe required for the measurement. A Managed Source subcircuit may represent a constant DC voltage source, or for other tests it may represent a start-up ramp, or even a pulsed line voltage source. In order to perform input impedance measurements, the Managed Source subcircuit may include components to inject an AC small signal perturbation into the circuit and measure the resulting input impedance. A full listing of available subcircuit definitions can be found in the symbol documentation.
3.2 DVM Control Symbol
The DVM control symbol contains a library of information about the circuit under test. Initially, we focus our attention on the Full PowerAssist Control symbol, which is used by all the Built-in Testplans and in all the examples in this tutorial. By double clicking the DVM Control symbol, an edit dialog will open allowing the entry of all simulation parameters. These simulation parameters will take precedence over any parameters set using the "Simulator|Choose Analysis.." menu. The DVM Control Symbol is electrically inactive, and doesn't contribute to the netlist.
3.3 Adding Input Source
Remove the DC voltage source V2 and replace it with a DVM Input Source selected from the parts selector category DVM|Source|Input Source.

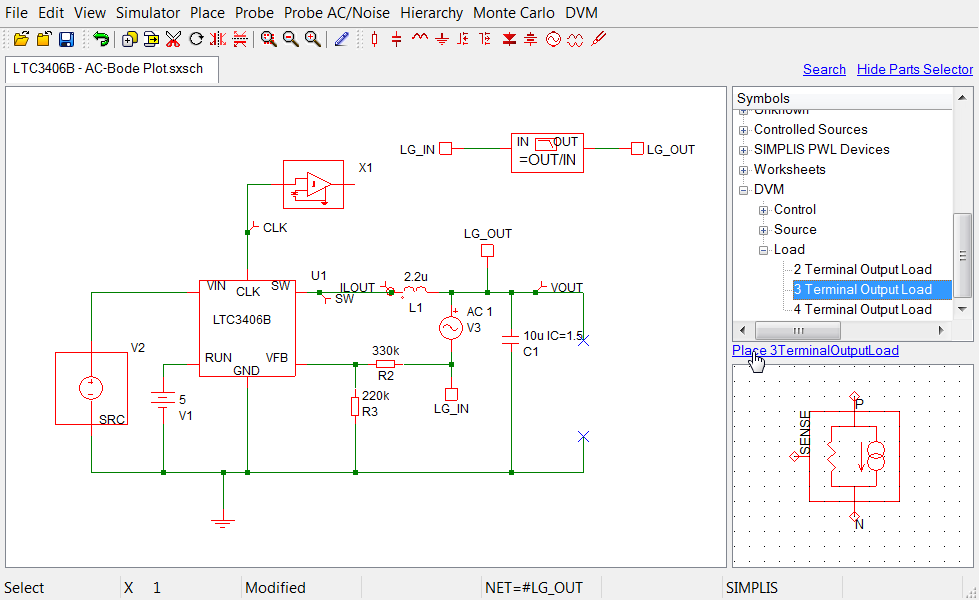
3.4 Adding Three Terminal Output Load
When using a 3- or 4- terminal DVM Output Load, the injected AC perturbation source and bode plot probe required for closed-loop AC analysis are automatically inserted into the Managed Load subcircuit definition.
Remove the existing resistor R1, the Bode Plot probe, the AC source V3, and the connectors used to measure the Bode Plot. Place a DVM 3-Terminal Output Load from the parts selector category DVM|Load|3-Terminal Output Load and connect the SENSE terminal to the resistor R2 to inject the AC signal into the loop during AC Loop stability analyses. For all other test objectives, the SENSE terminal will be shorted to the positive output terminal of the Managed Load.
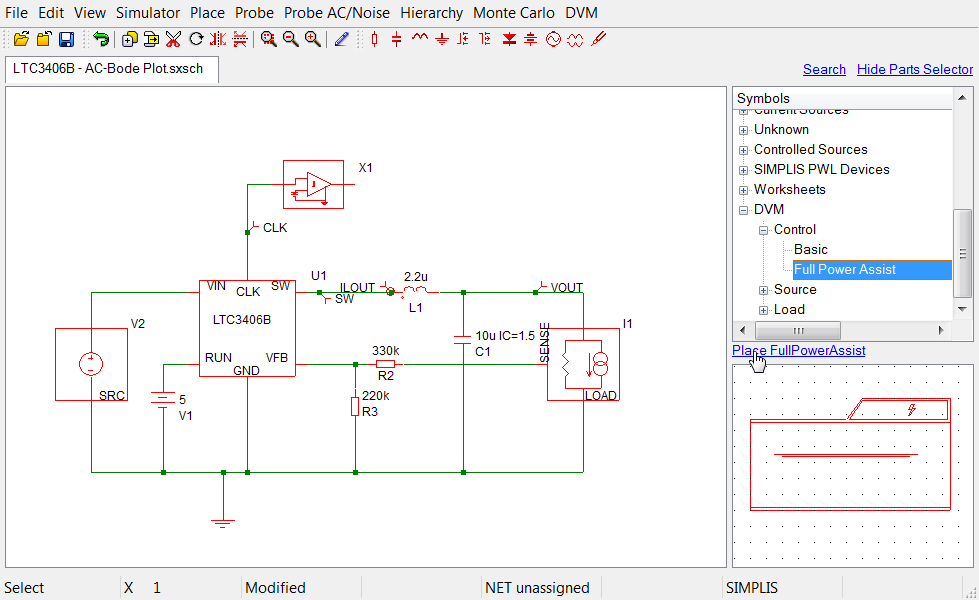
3.5 Adding Full Power Assist Control
Place a DVM Control symbol that supports Full PowerAssist from the parts selector category DVM|Control|Full PowerAssist.
3.6 Managing Sources and Loads
When the Full PowerAssist control symbol is placed on a schematic after the DVM sources and loads have been placed, the existing DVM sources and loads will automatically be managed. In other words, these sources and loads will be managed by the testplan for each simulation test. To tell whether your sources and loads are managed, look at the control symbol, the reference designators ( in this case V2, I1 ) will be noted on the symbol. In case the control symbol was placed before either the source or load, the following procedure should be followed to make the Managed Source and Managed Load assignments:
A DVM Control Symbol which doesn't yet have the sources and loads managed will look like this.
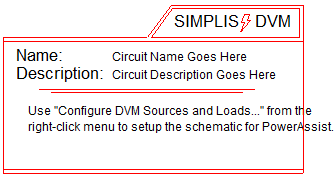
Use "Configure DVM Sources and Loads..." from the right-click menu to setup the schematic for PowerAssist.", continue to follow this section. Otherwise, rejoin the tutorial at section 3.7 Setting Control Parameters.
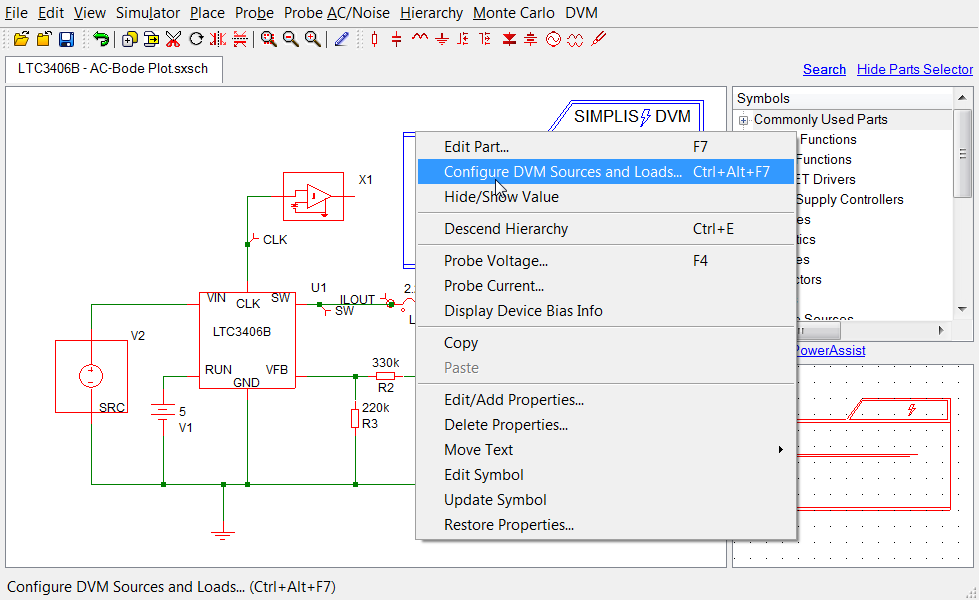
To configure the DVM Control to manage the schematic's DVM sources and loads, right-click on the DVM Control and choose "Configure DVM Sources and Loads..."
Choose "Configure Sources and Loads" and click OK.

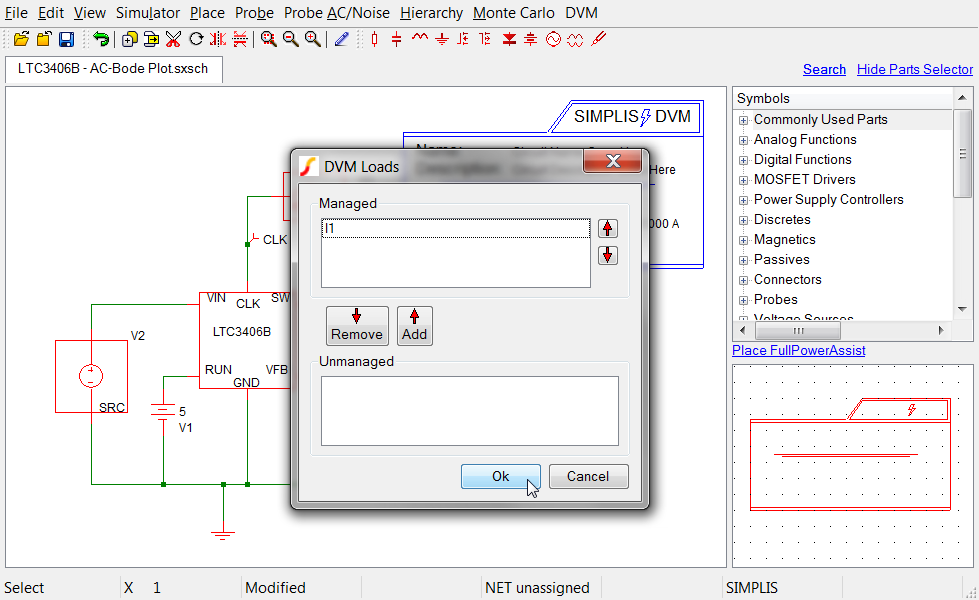
Make certain the DVM Input Source (V2) is in the list of Managed Sources.

Make certain the DVM Output Load (I1) is in the list of Managed Loads.
3.7 Setting Control Parameters
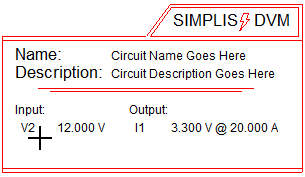
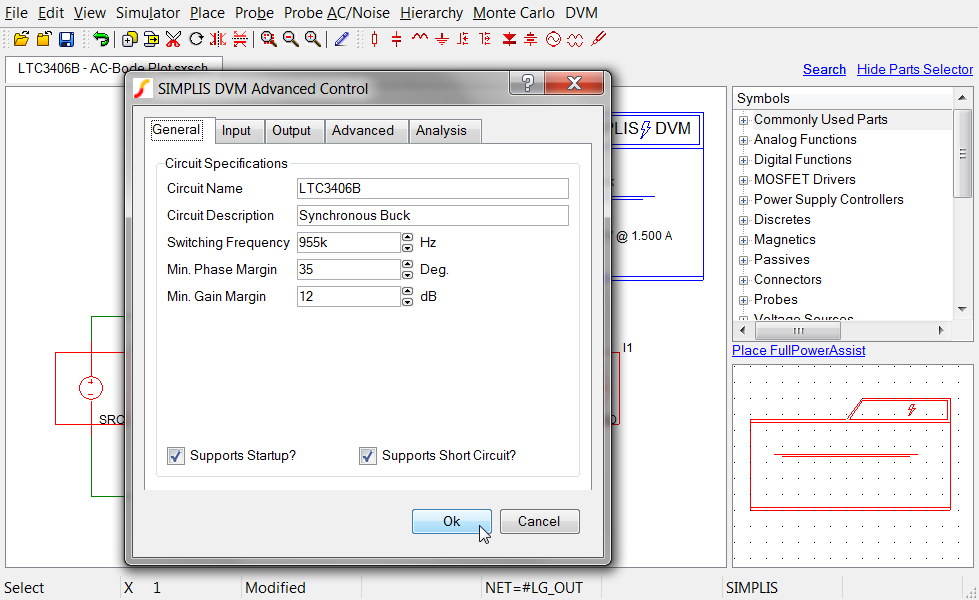
The DVM Control should then configure itself as having one input ( V2 ) and one output ( I1 ). While the default values for many parameters can be used for this circuit, parameters such as the input and output voltages, load current levels and switching frequency will need to be changed. Double click on the DVM Control and set the values for Circuit Name, Circuit Description and Switching Frequency under the General tab.
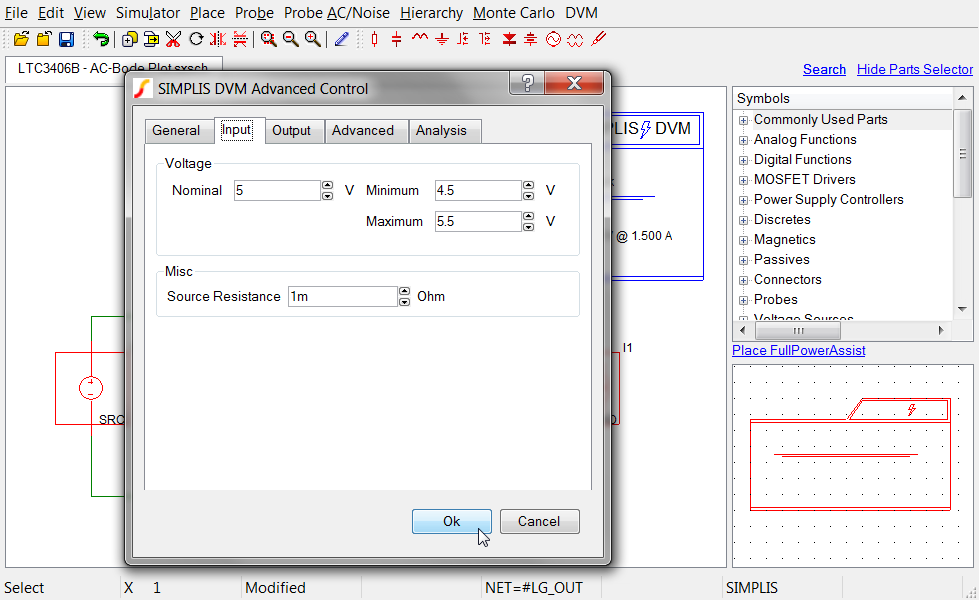
Under the Input tab, set the values for Nominal, Minimum and Maximum Input Voltage as shown here.
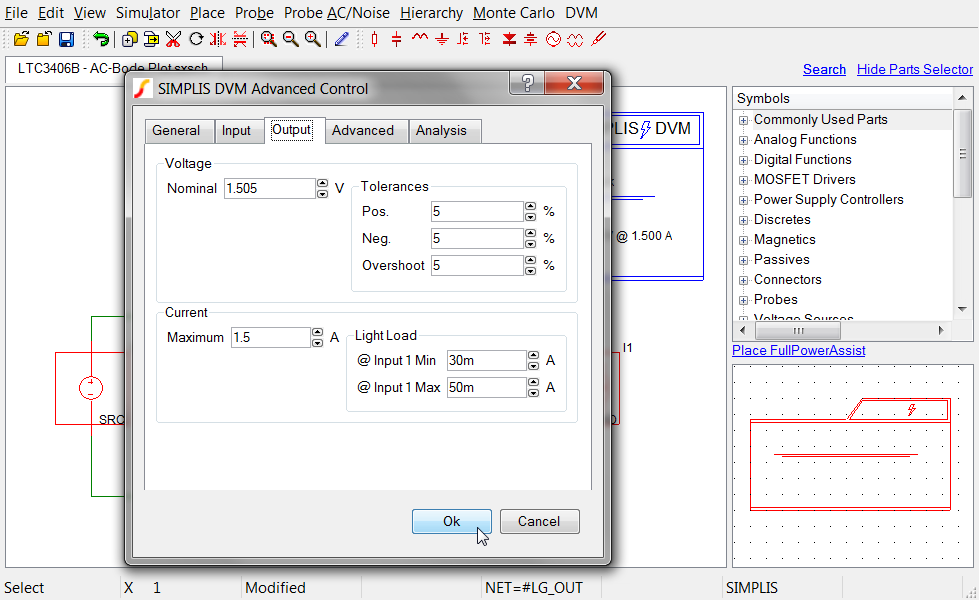
Under the Output tab, set the values for Nominal Output Voltage, Maximum Output Current as well as the values for Light Load @ Input1 Min and Max.
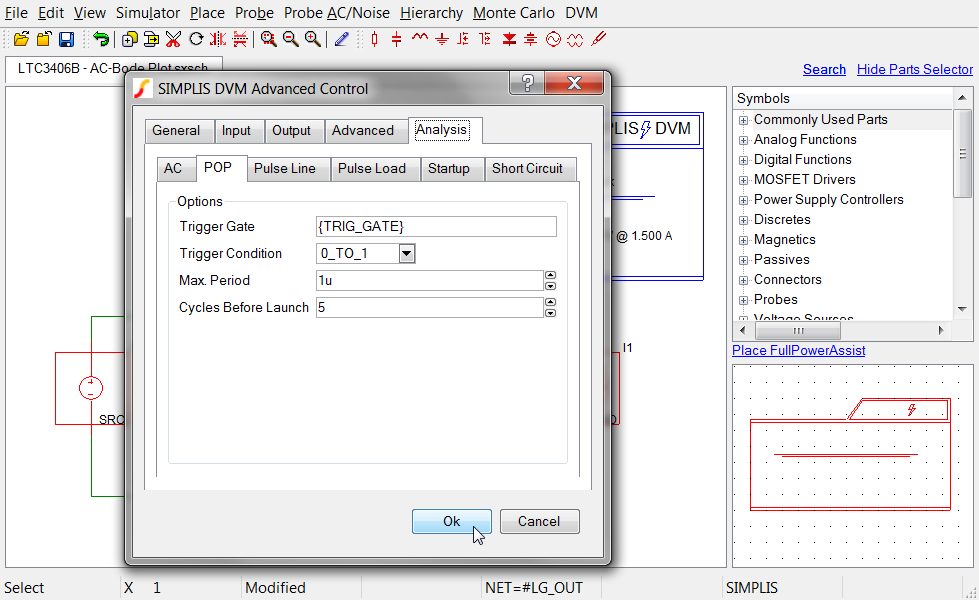
Under the Analysis tab, check the POP tab to be certain that the POP trigger information was correctly detected when the DVM Control was placed on the schematic. In particular the "Trigger Gate" field should be filled in as {TRIG_GATE}. This special value tells SIMPLIS to look for the POP trigger schematic device.
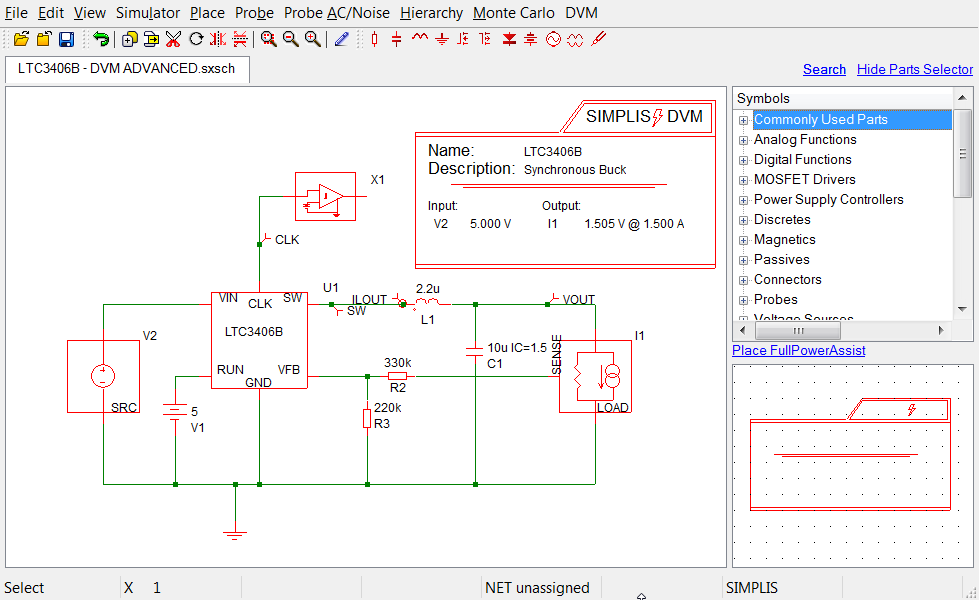
3.8 Schematic Configured for Full PowerAssist
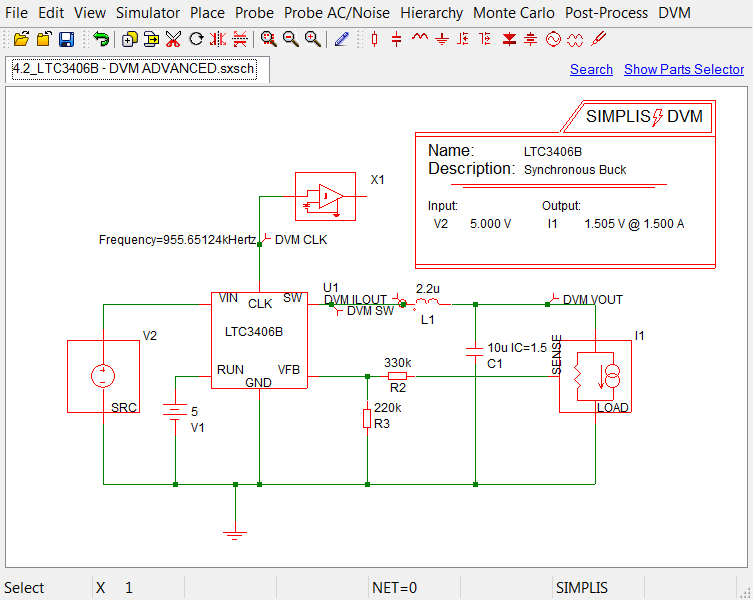
At this point, the schematic is properly configured for DVM Full PowerAssist. A version of this schematic that has already been properly configured for DVM can be found in the tutorial zip file.
LTC3406B/Test Ckts/LTC3406B - DVM ADVANCED.sxsch
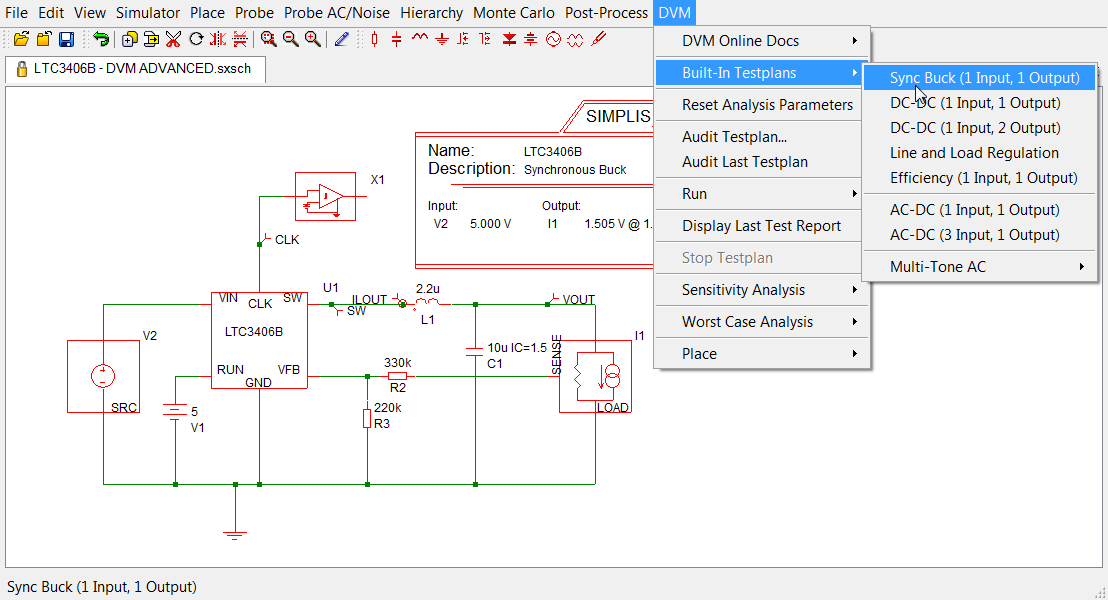
3.9 Selecting a Built-In Testplan
Once the DVM Control Symbol is configured, the schematic is ready to be run through its paces. From the built-in testplans menu, select the Sync Buck testplan (DVM|Built-In Testplans|Sync Buck (1 Input, 1 Output)).
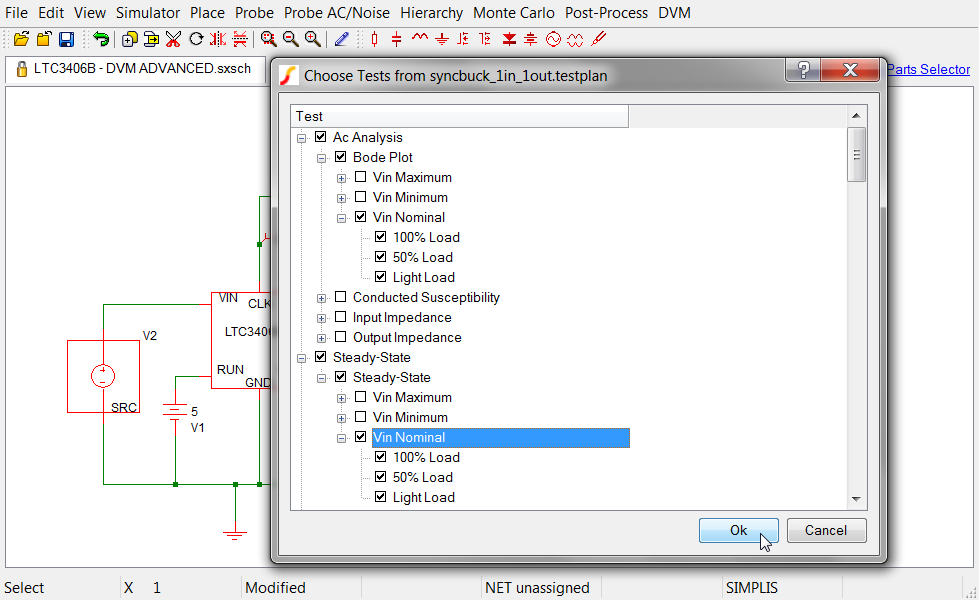
Select four to six tests to run. You can expect each test to take approximately 6 seconds.
3.10 Viewing Output Report
DVM will now automatically run the selected tests, collect the results and compare the simulation data to the specifications entered in the DVM Control symbol. If the same tests were selected as in the example, the overview report should show one test failure. In the image below, the overview report has been annotated to highlight the common data elements of the overview report:
- Schematic used for this report
- Testplan from which this report was generated. This will contain the complete testplan, not just the selected tests.
- Report Directory
- The Overview Log file contains information about each run, in text format.
- Number of tests run, the number of passed tests, etc.
- Tab separated text files with scalars measured and specs evaluated.
- Links to individual test reports

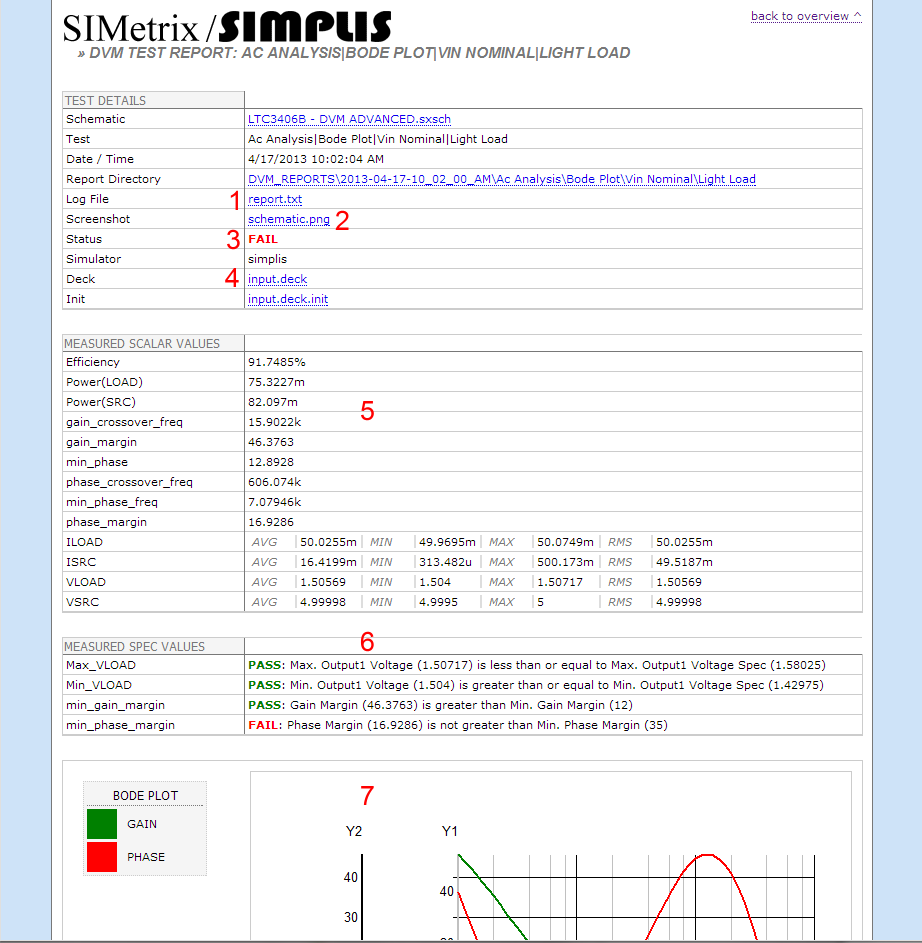
For this example, the first Bode Plot test at light load failed one of its test specifications. The test report shows that the simulated phase margin was below the specification value set in the DVM Control symbol. Here we have annotated important elements of an individual test report.
- Report file - a text version of this report containing information about all scalars and graphs.
- Screenshot of the schematic just before the simulation executed
- Pass/Fail Status
- Input Deck file on which the simulation was run
- Measured Scalars
- Measured Specs
- Graph Data
4.0 Adding Curves and Scalar Measurements to the Report
Adding simulation waveforms and scalar measurements to a DVM report is extremely easy. In the following subsections the details of each operation is explained using examples.
4.1 Curves from existing probes
When you open the previously run test report, you will notice there are three graphs. The first graph contains the AC Bode Plot waveforms, the second has the POP voltage and current in the output load I1, and the third has the input source POP voltage and current waveforms. The subcircuit that defines each DVM source and load contains probes which plot the terminal voltage and current. In addition, the Bode Plot Load also contains the special probe which generates the Loop Gain and Phase curves. The curves generated by these fixed probes inside DVM source and load subcircuits are always featured prominently in the report.
What about the other fixed probes on the schematic? There are four probes on the top level LTC3406B schematic. We find them on the SW node, CLK pin, the converter output voltage, and inductor current. The data for these curves was captured, but not displayed in the report. Instead, the section "Other SXGPH files" contains links to each graph file produced from schematic probes. By clicking on these links, you can open up these waveforms for viewing in the SIMetrix/SIMPLIS waveform viewer.
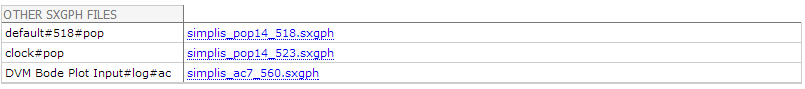
simplis_pop14_518.sxgph hyperlink at the very end of the test report.
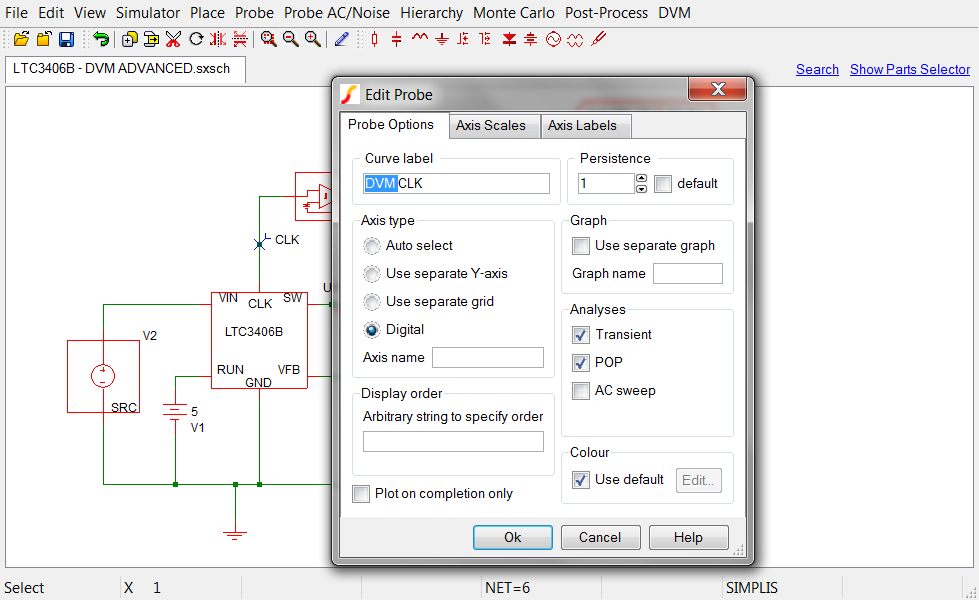
It is very easy to add new curves to the DVM report, so they appear as a graphic display on the report page, and not in the "Other SXGPH Files" section. All that needs to be done is to rename the curve labels to start with "DVM ". DVM will then remove the "DVM " from the curve labels and feature the graphs containing these curves in the report.
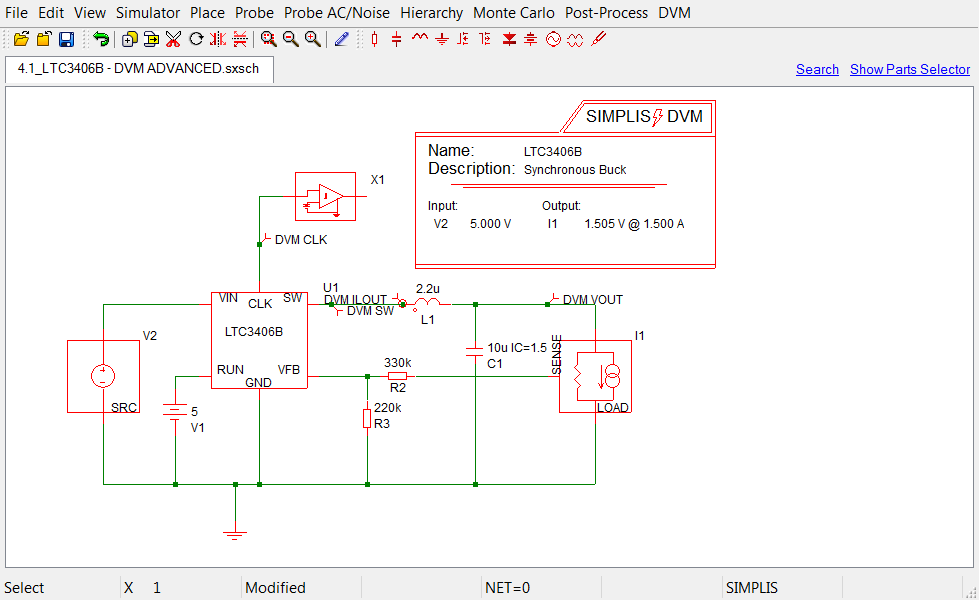
LTC3406B/Test Ckts/4.1_LTC3406B - DVM ADVANCED.sxsch
4.2 Scalar Measurements
DVM can automatically read fixed probe measurements, and report those measurements in the "Measured Scalar Values" section of the DVM report. DVM will read the scalar measurements from all probes whose curve label is prefixed with DVM. As an example, let's add a measurement for the converter switching frequency to the report. The LTC3406B has a CLK output pin which we can accurately measure the switching frequency, and we already have a probe on that signal. All we need to do is add the measurement to the probe and the scalar value will appear in the report.
Starting with the schematic we saved from section 4.1,
LTC3406B/Test Ckts/4.1_LTC3406B - DVM ADVANCED.sxsch
we will add the measurement to the DVM CLK probe. First, select the DVM CLK probe and right click to bring up the context menu:

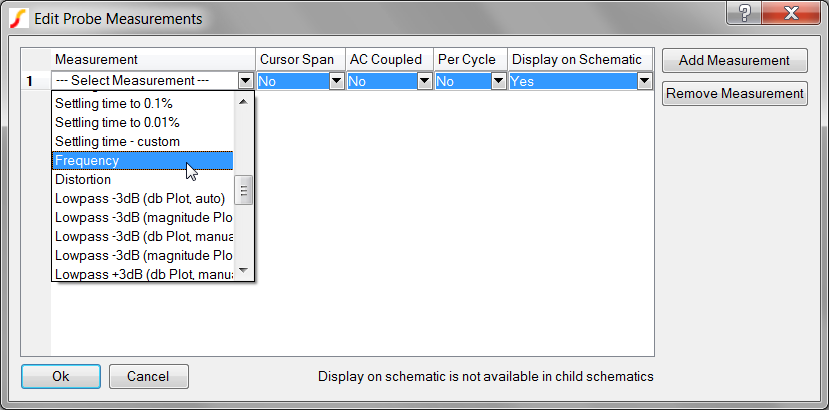
Frequency from the first column, and select Yes in the Display on Schematic column.
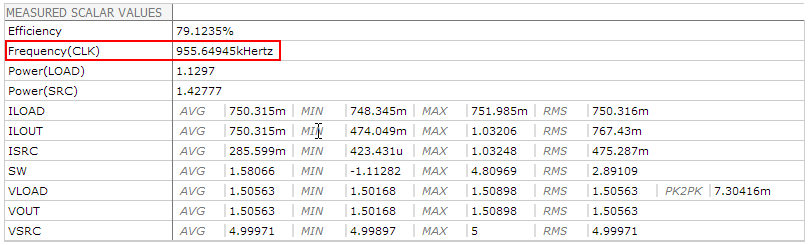
The schematic is now prepared to add a the switching frequency measurement to the test report. Let's run the built-in Sync Buck testplan on this circuit. To see the switching frequency, we'll run a Steady-State test at 50% load and nominal input. After running the simulation, you should see the Frequency scalar appear on the schematic, and if we view the
test report
we see the second scalar in the measured scalar values table is Frequency(CLK).
A few notes -
- Although in this example we selected the measurement value to be displayed on the schematic, this is completely optional. DVM doesn't require the measurement to be displayed on the schematic to read the scalar value, doing so in this example was a matter of convenience - by displaying on the schematic it's easy to see that the measurement executed properly.
- The built-in SIMetrix/SIMPLIS measurements system is smart enough to know the
Frequencymeasurement can only be applied to Transient or POP data. Therefore, if you run an AC analysis, the Frequency will be measured for the POP simulation, and no measurement will be made for the AC analysis.
An additional reference on the measurements system and the fixed probe measurements can be found in the SIMPLIS tutorial.
A schematic with the Frequency measurement added to the "DVM CLK" probe can be found in the tutorial zip file.
LTC3406B/Test Ckts/4.2_LTC3406B - DVM ADVANCED.sxsch
5.0 Running the Built-In Efficiency testplan and the Line and Load Regulation Testplans
Two other built-in testplans are included with DVM - Efficiency and Line and Load Regulation. Our schematic from section 4.1 or 4.2 will run these testplans directly. Let's use the last schematic from section 4.2.
LTC3406B/Test Ckts/4.2_LTC3406B - DVM ADVANCED.sxsch
5.1 Efficiency
The built-in Efficiency testplan runs a sequence of Steady-State simulations, and after all simulations complete, a special test Generate Efficiency Curves generates the familiar Efficiency vs. Load current curves. Three curves can be generated - one for each input voltage, Nominal, Minimum, Maximum. The Nominal, Minimum and Maximum input voltage values are taken directly from the DVM Control Symbol. When you first run the Efficiency testplan ( DVM|Built-In Testplans|Efficiency(1 Input, 1 Output)), a pop-up Hint will give some information about the numerical calculation methods used to calculate the Efficiency.

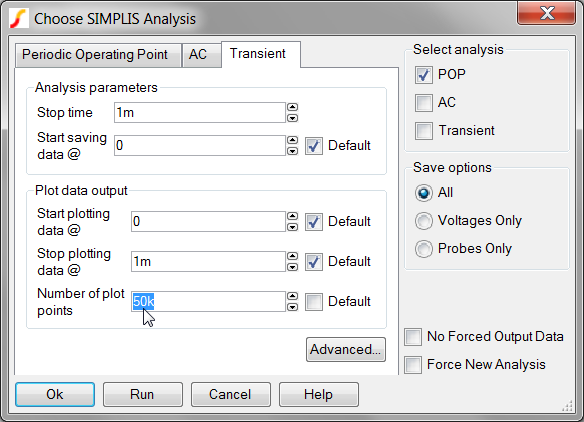
Before we actually run the efficiency testplan, let's check the "Number of plot points" setting. To do this, click "Close" the the Hint dialog, and "Cancel" on the test selection dialog. Then, go to the schematic menu ( Simulator|Choose analysis... ). When you select the transient tab, you will see the "Number of plot points" is set to 5k. Change this to 50k as shown below:
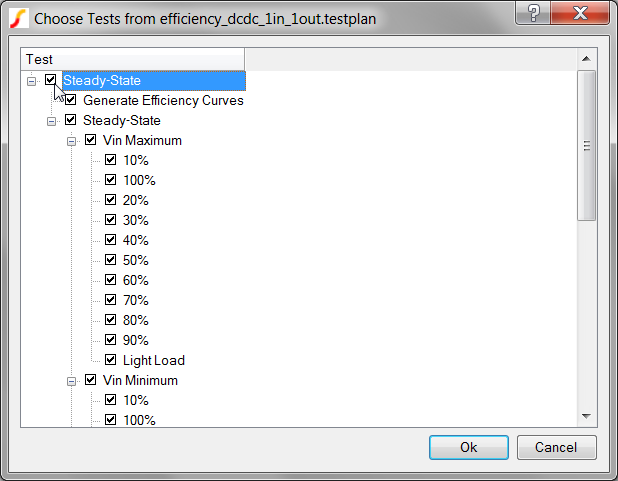
Now, let's go back and run the entire efficiency testplan. After selecting the menu option: ( DVM|Built-In Testplans|Efficiency(1 Input, 1 Output)) and clicking "Close" to the Hint dialog, the test selection dialog appears:
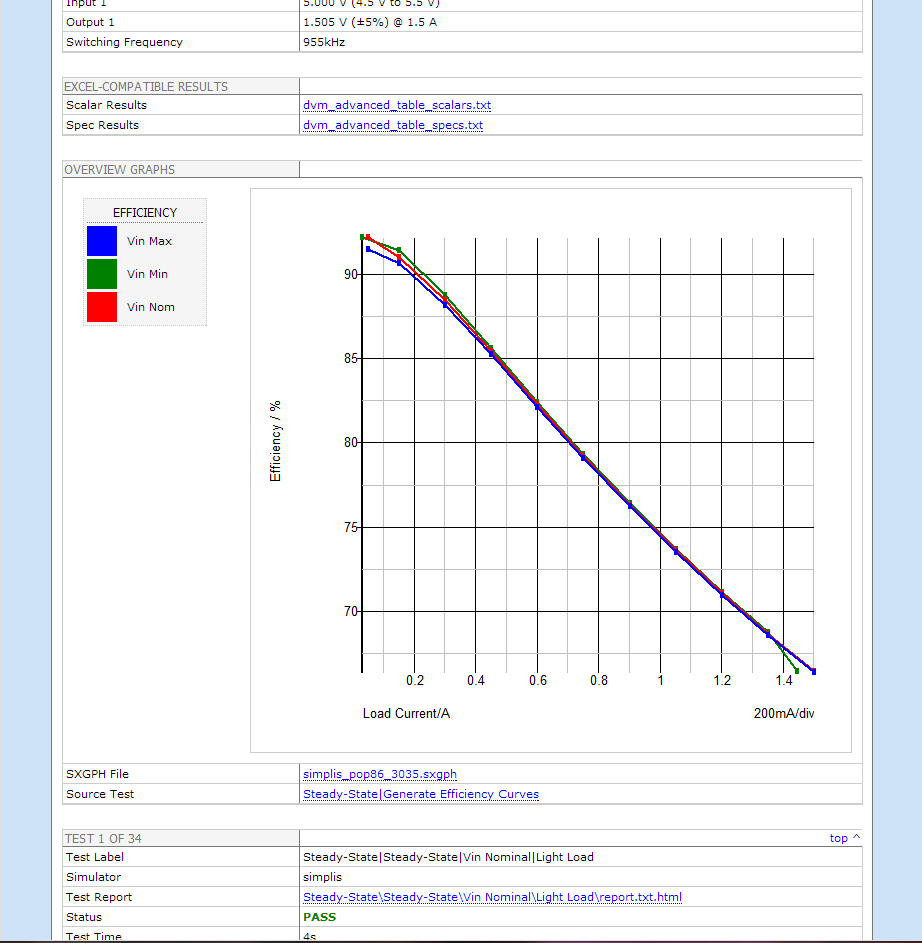
Generate Efficiency Curves test, and a copy was placed on the overview report with the PromoteGraph testplan measurement function. The curves themselves are also different than curves we have seen previously in this tutorial. These curves are formed from data aggregated from each of the previous tests in this testplan. Each point represents the Efficiency measured during an individual POP simulation run. The actual curves were generated with the CreateXYScalarPlot covered in section 6.6.2 CreateXYScalarPlot function. The PromoteGraph function is covered in detail in section 6.4.2 Promoting Graphs to the Overview Report. Note that this model has high conduction losses, and doesn't incorporate switching losses. This combination results in Efficiency curves which are quite resistive in nature. If the model were to incorporate switching and other AC losses, the efficiency curves would reflect those losses.
5.2 Line and Load Regulation
The Line and Load Regulation testplan is custom built for the schematic being tested when the menu option (DVM|Built-In Testplans|Line and Load Regulation ) is executed. For this reason, no test selection dialog is presented at run time, instead, the entire testplan is executed.
The Line and Load Regulation data are presented in the overview report section CALCULATED RESULTS.

A note about the results presented in this particular report - this converter enters current limit at low line at 100% load. Thus the measured results for Line and Load Regulation (Input 1 , Output1 ) are much higher than expected. To verify this, the maximum output current (3.7 Setting Control Parameters) can be reduced from 1.5 to 1.45A and the resulting Line and Load Regulation values will be as expected.
5.3 Summary
In Part 1 of this DVM Tutorial, we have shown how to configure a working schematic so that it will run successfully in DVM. Typically, this involves replacing the existing source(s) and load(s) with DVM source(s) and load(s) and then adding a DVM Control symbol to the schematic. Once the Managed sources and loads have been configured, the circuit is ready to run one of the Built-in DVM Testplans. The process for configuring a schematic to run in DVM is simple enough to execute in about 5 minutes. At this point, the schematic is ready to run any of the applicable built-in DVM test plans.
We first ran one of the built-in testplans on our example Sync Buck DC-DC converter. We saw how to select a subset of tests to run from the testplan and we looked at each of the key elements of the resulting DVM Test Report. We learned how to add waveforms and scalar measurements to the DVM report. Finally, we looked at two more built-in testplans, Efficiency and Line and Load Regulation.
In Part 2 of the DVM Tutorial we learn how to customize testplans to meet our particular testing requirements. We find several ways to change component values, add curves to our reports from the testplan, and to generate tests summarizing results.
When you are ready to start, you can click on DVM Tutorial Part2.
© 2013 simplistechnologies.com | All Rights Reserved